What a Tesla Model Y costs to own in Ontario
A Tesla Model Y Standard lists at $49,990 and drives off an Ontario dealer's lot at $59,497 once HST and the fees are on it, which in Toronto works out to $1,620 a month all-in at 7.99% APR over 60 months (5.99% to 9.99% for your credit). That is the whole cost of having the car, not the loan payment: insurance, fuel, maintenance and licensing are in it. Carrying it at 15% of before-tax income, the top of the band this calculator calls manageable, takes about $130,000 a year on one income.
Change a figure and this answers for your own car rather than the example above. Nothing you type here is stored or sent anywhere.
Base trim MSRP
$49,990
Standard, 2026 Canadian pricing read 2026-01-08
Drive-away in Ontario
$59,497
MSRP, freight and PDI, HST, levies and plates
Income it needs
$130,000
a year before tax, one person, to read Manageable
Trims, prices and paint are 2026 Canadian pricing, each read on the date shown beside it. A dealer's written quote is the number that counts.
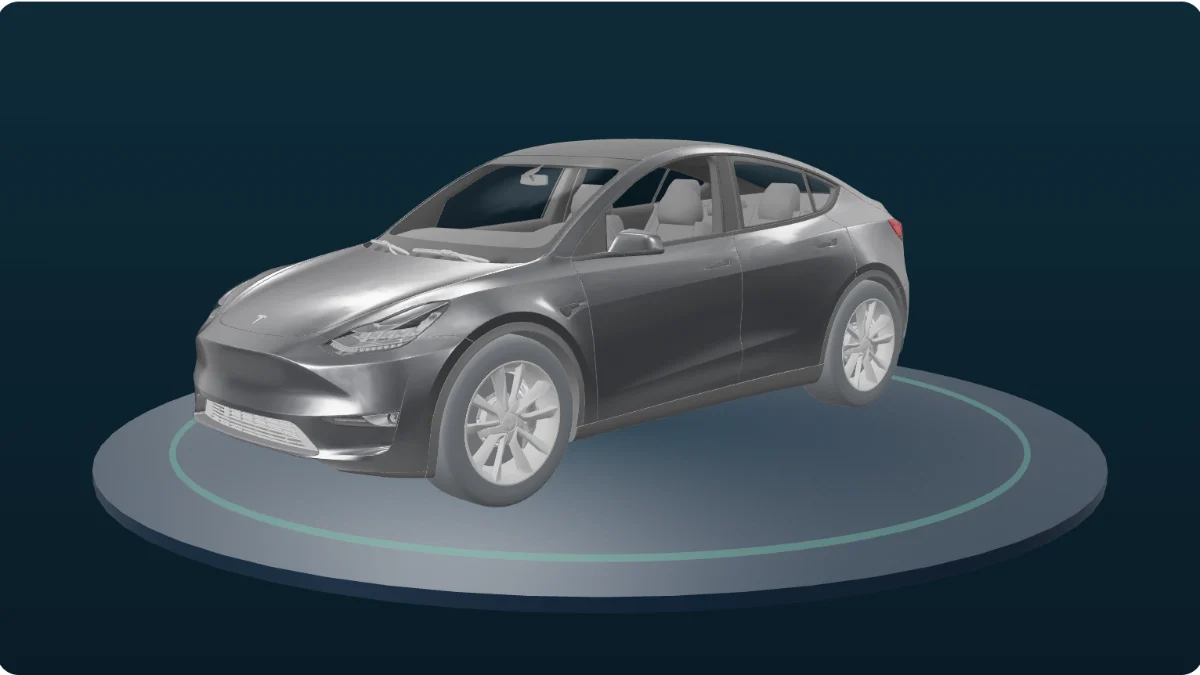
| Trim | MSRP | Drive-away in Ontario |
|---|---|---|
| StandardRWD, electric, single rear motor, 463 km range, 0 to 100 km/h in 7.2 seconds | $49,990 | $59,497 |
| Premium AWDAWD, electric, dual motor all-wheel drive | $64,990 | $76,447 |
| PerformanceAWD, electric, dual motor all-wheel drive with adaptive suspension and vehicle-to-load | $74,990 | $87,747 |
| City | Insurance a month | All-in a month |
|---|---|---|
| Toronto | $216 to $250 | $1,620 |
| Brampton | $307 to $383 | $1,732 |
| Ottawa | $155 to $190 | $1,560 |
What you need to earn for a Tesla Model Y
About $130,000 a year before tax, on one income, no other debt and nothing down. That figure is not a rule of thumb: it is the income at which this exact car's all-in monthly cost lands on 15% of gross, which is the top of the manageable band. It is a ceiling rather than a target. Earning it does not make the Standard comfortable, it makes it the most car the band will still call manageable, and the verdict slips to Tight below it. Every dollar of the cost comes out of take-home while the share is measured on gross, so the bite feels larger than 15% in a bank account.
How long you owe more than a Tesla Model Y is worth
33 months on a 60 month loan, and 57 months on 84 months, both with nothing down. You are underwater from the day of sale because the tax and fees finance along with the car while the car is only worth its price. The gap closes as the balance falls faster than the value does, and it closes later on a longer term. This only costs you money if you sell or trade before it closes, and then it costs you all of it, because whatever you still owe rolls into the next loan. The negative equity calculator takes a real trade-in, with what you still owe on it.
Factory paint, and what it costs
- Stealth GreyNo charge
- Pearl White Multi-Coat$1,300
- Diamond Black$2,000
- Marine Blue$1,300
- Quicksilver$2,600
- Ultra Red$2,600
Manufacturer paint names and prices, read from the Canadian configurator on the dates shown. Not published means exactly that: a manufacturer prices a colour only on the trims that offer it, so an upcharge that could not be read is left blank rather than guessed from the pattern that pearls cost extra and metallics do not. This nameplate's file records 4 such gaps, each one naming the pages that were opened looking for the figure.
| Model | Base MSRP | Drive-away | All-in a month in Toronto |
|---|---|---|---|
| Chevrolet Equinox | $36,899 | $44,478 | $1,493 |
| Chevrolet Silverado | $55,099 | $65,496 | $1,996 |
| Ford F-150 | $52,690 | $62,768 | $1,940 |
| GMC Sierra | $56,399 | $66,965 | $2,025 |
| Honda Accord | $38,600 | $45,869 | $1,476 |
| Honda Civic | $28,440 | $34,388 | $1,243 |
| Honda CR-V | $37,075 | $44,338 | $1,491 |
| Hyundai Elantra | $23,499 | $28,884 | $1,132 |
| Hyundai Kona | $27,449 | $33,686 | $1,275 |
| Hyundai Tucson | $35,499 | $42,783 | $1,459 |
| Jeep Wrangler | $54,895 | $64,808 | $1,906 |
| Kia Sportage | $32,295 | $39,145 | $1,385 |
| Mazda CX-5 | $36,300 | $43,682 | $1,477 |
| Mazda Mazda3 | $25,250 | $31,083 | $1,176 |
| Nissan Rogue | $34,848 | $41,912 | $1,441 |
| Nissan Sentra | $25,268 | $30,826 | $1,171 |
| Tesla Model 3 | $39,490 | $47,632 | $1,380 |
| Tesla Model Y | $49,990 | $59,497 | $1,620 |
| Toyota Camry | $35,075 | $41,920 | $1,332 |
| Toyota Corolla | $25,020 | $30,444 | $1,163 |
| Toyota RAV4 | $37,500 | $44,739 | $1,421 |
| Toyota Tacoma | $50,470 | $59,395 | $1,872 |
| Volkswagen Tiguan | $37,495 | $45,038 | $1,505 |
People also ask
How much does a Tesla Model Y cost per month in Ontario?
The all-in figure for the Standard in Toronto is in the sentence at the top of this page, with its rate and its term beside it. What matters about it is what is in it: the loan payment is only 74% of the number, and insurance, fuel, maintenance and licensing are the rest. That is why a dealer's payment quote and the cost of having the car are two different figures. Where you park it moves the total too: the same Standard costs about $172 a month more in Brampton than in Ottawa, and insurance is the whole of that gap.
What income do you need for a Tesla Model Y?
About $130,000 a year before tax for the Standard, on one income rather than a household's. That is the point where the car's full monthly cost sits exactly at 15% of gross, the top of the band this calculator calls manageable, so a dollar less income and the verdict slips to Tight. The share is measured on before-tax income because that is what the bands are defined on; every dollar of the cost leaves your take-home. A down payment, a trade-in or cheaper insurance all pull the figure down.
How long are you upside down on a Tesla Model Y?
About 33 months on a 60 month loan with nothing down, and about 57 months if you stretch it to 84 months. You start underwater because the tax and fees roll into the balance while the car is only worth its price, and you stay there until the payments catch up with the depreciation. That is the number that matters if you might trade before the loan ends, because whatever you still owe rides into the next contract.
Sources
Every price, fee and paint colour above, with the page it was read from, the date it was read and how much weight that source carries. A manufacturer’s own Canadian site is high confidence, a reputable Canadian third party is medium.
- trims.Standard.msrpCad, $49,990 · read 2026-01-08 · medium confidence
- pricing.freightAndPdiCad, $2,500 · read 2026-05-01 · medium confidence
- pricing.airConditioningExciseTaxCad, $100 · read 2026-09-01 · high confidence
- trims.Premium AWD.msrpCad, $64,990 · read 2026-01-08 · medium confidence
- trims.Performance.msrpCad, $74,990 · read 2025-11-20 · medium confidence
- colours.Stealth Grey, no charge · read 2026-01-08 · medium confidence
- colours.Pearl White Multi-Coat, $1,300 · read 2026-01-08 · medium confidence
- colours.Diamond Black, $2,000 · read 2026-01-08 · medium confidence
- colours.Marine Blue, $1,300 · read 2026-01-08 · medium confidence
- colours.Quicksilver, $2,600 · read 2026-07-31 · low confidence
- colours.Ultra Red, $2,600 · read 2026-07-31 · low confidence
And every market figure the engine read while it priced this car, recorded as it ran rather than listed by hand, so this cannot name a figure the calculation did not use or leave out one it did. The full file is on the assumptions page.
Official energy, Reference tou commodity rate$0.128 per kWh
Ontario Energy Board time-of-use commodity rates, weighted with the OEB reference consumption shares and effective 2025-11-01 through 2026-10-31. Electricity commodity rates only; fixed service and utility-specific delivery charges are excluded.
Federal luxury tax, Threshold CAD$100,000
Applies to vehicles above 100000 dollars, manufactured after 2018, seating 10 or fewer, gross vehicle weight rating at or below 3856 kg, four or more wheels. Confirmed still in force for 2026. Charged before HST, so HST compounds on top of the luxury tax.
Ontario tax, Harmonized sales tax rate13%
Registered dealer sale, new or used. Charged on the negotiated all-in selling price and collected by the dealer at the point of sale.
Licensing, Private sale transfer total CAD$60 to $120
Typical total for a private-sale transfer path, including the UVIP and the plate and permit issuance. Excludes the safety certificate, which report 01 section 2.7 leaves unpriced. Small and honest beats a padded guess here; the dollar impact is minor but the accuracy is a credibility signal.
Licensing, Used vehicle information package CAD$20
Mandatory for private sales. Set fines for failing to provide or deliver a UVIP rose to 140 dollars in January 2026.
Financing, Apr by credit band, Prime5.99% to 9.99%
Credit score 670 to 719. Most dealers and lenders set a mid 600s minimum score for standard approval.
Insurance, By city, Toronto, Annual premium CAD$2,348 a year to $2,483 a year
Second-source pass, 1 September 2026. Toronto had one publisher behind it, ThinkInsure, and now has two. ThinkInsure publishes 2,483 for the window 31 May 2025 to 31 May 2026, confirmed this pass by direct fetch of https://www.thinkinsure.ca/car-insurance/toronto-quote.php rather than the search-indexed excerpt the previous note relied on. MyChoice independently publishes 2,348 for Toronto in its 22 June 2026 Ontario city table, up 5.26 percent year over year. The two are 5.7 percent apart measured on the lower figure, inside the 10 percent agreement bar, so the figure is the range spanning both published values and confidence stays medium on two agreeing publishers rather than one. Neither value was altered. asOf stays 2026-05-31, the close of the ThinkInsure window that sourceUrl points at.
Insurance, Ontario year over year increase4.45%
Ontario premiums rose roughly 4.45 percent year over year in 2026. The July 1 2026 reform made most accident benefits other than medical, rehabilitation and attendant care optional, which may lower premiums modestly, but the real movement will not be observable until Q1 2027.
Insurance, New driver, Full licence average annual premium CAD$2,105 a year
The all-ages full-G average from the same dataset, published beside the G2 one so the two are comparable. ThinkInsure, an Ontario brokerage, over a stated data window of 2022-01-01 to 2023-03-31. The as-of date is the close of that window rather than a publication date, because the window is the honest limit on the figure: no named publisher has released a G2-specific band since it closed. No insurer and no regulator publishes a G2 band at all, so a broker's dataset is the ceiling of the available evidence, which is why nothing in this group is high confidence.
Insurance, By licence class and age, Full age 26 to 30 annual CAD$2,437 a year
Full G licence, 26 to 30. The gap to the G2 figure opens to about 25 percent here, having been near zero in the teen bands. ThinkInsure, an Ontario brokerage, over a stated data window of 2022-01-01 to 2023-03-31. The as-of date is the close of that window rather than a publication date, because the window is the honest limit on the figure: no named publisher has released a G2-specific band since it closed. No insurer and no regulator publishes a G2 band at all, so a broker's dataset is the ceiling of the available evidence, which is why nothing in this group is high confidence.
Operating, Average annual kilometres16,000 km a year to 24,000 km a year
Derived proxy, not a measured average. Report 01 publishes no average-annual-kilometres figure anywhere. Section 2.13 gives a typical lease annual km allowance of 16000 to 24000 km per year, which is the only kilometre band in the research, so it stands in as the driving-distance band. A lease allowance is set to cover typical driving rather than to measure it, so this band runs high. Cross-check against report 01 section 2.8's 150 to 250 dollar per month gasoline band, at the same section's 1.70 per litre price: at 16000 km every class consumption figure below lands inside that band, 159 dollars for a sedan to 249 for a pickup, and at the 20000 km midpoint the lighter classes stay inside it while a pickup runs above at 312. That band is not class-specific, so the overrun is expected rather than a contradiction. Source a StatCan or Natural Resources Canada annual vehicle-kilometres figure before any page quotes a driving distance.
Operating, Electric vehicle consumption kWh per 100 km16 kWh / 100 km
Stated in report 01 section 2.8 as the mid-size EV reference: 16 kWh per 100 km, which at the off-peak rate of 0.076 per kWh gives the 1.22 dollars per 100 km the same section quotes. That internal arithmetic checks out exactly, which is why this is the one figure in this group above low confidence. It is still a single mid-size reference and does not vary by vehicle class.
Operating, Home charging share45% to 80%
Derived, not sourced. The share of charging done at home rather than at public DC fast chargers. Solved as the band that reproduces report 01 section 2.8's 50 to 80 dollars per month EV charging figure, using the same section's time-of-use rates averaged across on, mid and off peak, its public rate of 0.35 to 0.55 per kWh, its 16 kWh per 100 km consumption and the averageAnnualKilometres midpoint. An 80 percent home share lands at 49.32 dollars a month, a hair under the 50 dollar floor, and a 45 percent home share at 80.24. This is a user-facing slider in the product, so the figure only sets the starting position.
Electricity, Public dc fast charging per kWh$0.45 per kWh to $0.75 per kWh
Up from [0.35, 0.55] in the 2026-08 vintage. Confirmed twice via search-indexed content directly attributed to this URL, but other current sources give materially different ranges (0.30-0.65, 0.37-0.80), so confidence is downgraded to low pending a direct fetch of the live page, which this audit environment could not reach.
Maintenance, Monthly under five years$100 a month
Vehicle under 5 years old. Sits inside the broader 500 to 1500 dollar per year routine-maintenance range report 01 section 2.11 documents, and near the CAA scheduled-maintenance reference of 500 to 700 dollars per year.
Depreciation, Year one rate20% to 30%
Up from [0.15, 0.30] in the 2026-08 vintage; low end moved from 15 percent to 20 percent. Source now states "a new car generally depreciates between 20% to 30% in the first year", confirmed via two independent search queries with matching quotes. Verified through search-indexed content rather than a direct fetch, which this audit environment could not reach; a direct-fetch re-check is recommended. Luxury vehicles and weak-resale nameplates run 25 to 35 percent in year one per the prior vintage; unable to re-confirm that detail this cycle.
Depreciation, Segment multiplier, Electric1.37
Derived, not separately sourced. 0.572 divided by 0.418, rounded to three decimals.
Depreciation, Five year rate by segment, Electric57.20%
U.S.-market iSeeCars proxy reported by The Car Guide, not Canadian model-specific resale evidence. EV five-year depreciation is materially worse than the 41.8 percent U.S. all-vehicle average in that study. Actual Canadian resale can differ substantially by model, trim, condition and local demand. Generic comparisons keep any unverified EVAP amount outside the total.
Lender ratios, Total debt service maximum44%
CMHC maximum. Housing plus all other debt divided by gross income. Car loans and leases count at the full monthly payment, which is what makes the mortgage-impact figure derivable.
Mortgage, Amortization months300 months
Modelled, not sourced. 25 years is the conventional Canadian mortgage amortization for qualification math. Report 01 publishes no amortization period. Paired with the derived qualifying rate to set the annuity factor behind the mortgage-capacity figure.
Mortgage, Conventional five year fixed rate6.09%
Bank of Canada series V80691335, labelled "Conventional mortgage: 5-year" and described by the publisher as "the interest rate for a 5-year conventional mortgage offered by chartered banks in Canada". The weekly reading was 6.09 percent on 2026-08-26 and unchanged over the five preceding weeks. This is the CONTRACT rate the qualifying rate is derived from. IT IS A POSTED RATE, WHICH IS THE CAVEAT THAT HAS TO RIDE WITH IT. A posted rate is what a chartered bank advertises, and it sits well above what most borrowers actually sign: discounted and broker-sourced contract rates are routinely one to two points lower, and the Bank publishes no series for those. So the greater-of rule applied to this number returns a qualifying rate higher than the one a real borrower would be tested at, which makes the mortgage capacity a car payment costs a FLOOR rather than an estimate: a borrower on a discounted rate loses more capacity than the figure shows, never less. The direction is deliberate, because understating the cost of a car payment is the failure this product exists to correct. Replace with the reader's own contract rate the moment a field collects one; nothing in ScenarioInput does today. Replaces the 2026-09 vintage's single modelled qualifyingRate figure of 0.0525, which was the stress-test floor used directly as an annuity rate and named no source.
Mortgage, Qualifying rate stress points2%
The two percentage points added to the contract rate under the OSFI minimum qualifying rate for uninsured mortgages, which the publisher states as "the greater of the mortgage contract rate plus 2% or 5.25%". Page last updated 2026-01-29.
Mortgage, Minimum qualifying rate floor5.25%
The other half of the same greater-of rule: the 5.25 percent floor that binds only when the contract rate is below 3.25 percent. It has not bound since 2022 and does not bind at the current 6.09 percent conventional rate, but it is held as a figure rather than as a constant because it is the published rule and a falling rate environment would make it bind again.
Verdict thresholds, Easy maximum income share10%
Total transportation cost at or below 10 percent of gross income is 20/4/10 compliant. Report 01 section 2.15 is blunt that with total ownership cost near 1373 dollars a month the 10 percent rule is out of reach for all but the wealthiest Canadians, so present it as a guardrail rather than a gate.
Verdict thresholds, Manageable maximum income share15%
10 to 15 percent of gross income is realistic for most Canadians.
Verdict thresholds, Tight maximum income share20%
15 to 20 percent is stretched. Above 20 percent carries a high risk of payment stress.
Run it on your own numbers
This page holds everything still except the car: a 60 month loan, nothing down, no trade-in, Toronto insurance, one income and no other debt. The calculator opens with the Standard's drive-away price and this car already in it, so you can bend every one of those toward your own life and watch the verdict move.
Price a Tesla Model Y on my numbers