Press kit: the Ontario insurance spread
CarVerdict.ca is a free Ontario car affordability calculator. It is independent and privately run, it carries no advertising, no affiliate links and no lead form, it asks for nothing to show a result, and every figure behind an answer is a dated entry with a publisher you can open. This page is for journalists: the ranked table, the source and the date behind each row, the same car priced in two cities, and permission to republish any of it.
Assumptions version 2026-10, compiled 1 September 2026.
The finding, stated precisely
Across 25 Ontario cities the published average car insurance premium runs from $1,567 to $1,738 a year in Kingston, which is $131 to $145 a month, to $3,325 to $3,802 in Brampton, which is $277 to $317 a month. That is a gap of $147 to $186 a month, or $1,758 to $2,235 a year, between the cheapest and the most expensive city in the same province under the same regulator.
Two things worth keeping straight. The ranked table is built from published city averages across many drivers, not from one car and one driver. The same-car figures further down are a separate thing: they come from running one identical scenario through the calculator in two cities. Both are honest and they are not the same claim.
The ranked table, with every source
| Rank | City | Published average, a year | About a month | Published by | Read on |
|---|---|---|---|---|---|
| 1 | Kingston | $1,567 to $1,738 | $131 to $145 | MyChoice | 22 June 2026 |
| 2 | Ottawa | $1,680 to $1,886 | $140 to $157 | ThinkInsure | 31 May 2026 |
| 3 | Peterborough | $1,739 | $145 | MyChoice | 22 June 2026 |
| 4 | Burlington | $1,761 to $1,806 | $147 to $151 | MyChoice | 22 June 2026 |
| 5 | Kitchener | $1,810 to $2,307 | $151 to $192 | MyChoice | 22 June 2026 |
| 6 | St. Catharines | $1,829 to $1,877 | $152 to $156 | MyChoice | 22 June 2026 |
| 7 | Guelph | $1,846 to $1,947 | $154 to $162 | MyChoice | 22 June 2026 |
| 8 | Waterloo | $1,853 to $2,355 | $154 to $196 | MyChoice | 22 June 2026 |
| 9 | Hamilton | $1,870 to $2,588 | $156 to $216 | MyChoice | 31 May 2026 |
| 10 | Brantford | $1,899 to $1,902 | $158 to $159 | MyChoice | 22 June 2026 |
| 11 | Niagara Falls | $1,919 | $160 | MyChoice | 22 June 2026 |
| 12 | Oakville | $1,950 to $1,970 | $163 to $164 | MyChoice | 22 June 2026 |
| 13 | Cambridge | $1,954 to $1,979 | $163 to $165 | MyChoice | 22 June 2026 |
| 14 | Thunder Bay | $1,989 to $2,032 | $166 to $169 | MyChoice | 22 June 2026 |
| 15 | Milton | $2,003 to $2,272 | $167 to $189 | MyChoice | 22 June 2026 |
| 16 | Windsor | $2,035 to $2,164 | $170 to $180 | MyChoice | 22 June 2026 |
| 17 | London | $2,037 to $2,267 | $170 to $189 | MyChoice | 31 May 2026 |
| 18 | Oshawa | $2,116 to $2,335 | $176 to $195 | MyChoice | 22 June 2026 |
| 19 | Barrie | $2,118 to $2,148 | $177 to $179 | MyChoice | 22 June 2026 |
| 20 | Mississauga | $2,258 to $2,717 | $188 to $226 | MyChoice | 31 May 2026 |
| 21 | Markham | $2,331 to $2,364 | $194 to $197 | MyChoice | 22 June 2026 |
| 22 | Toronto | $2,348 to $2,483 | $196 to $207 | ThinkInsure | 31 May 2026 |
| 23 | Richmond Hill | $2,422 to $2,441 | $202 to $203 | MyChoice | 22 June 2026 |
| 24 | Vaughan | $2,705 | $225 | MyChoice | 22 June 2026 |
| 25 | Brampton | $3,325 to $3,802 | $277 to $317 | MyChoice | 29 August 2026 |
- 11 of the 25: MyChoice, read 22 June 2026, medium confidence.
- 8 of the 25: MyChoice, read 22 June 2026, low confidence.
- 3 of the 25: MyChoice, read 31 May 2026, low confidence (Hamilton, London, Mississauga).
- 1 of the 25: ThinkInsure, read 31 May 2026, low confidence (Ottawa).
- 1 of the 25: ThinkInsure, read 31 May 2026, medium confidence (Toronto).
- 1 of the 25: MyChoice, read 29 August 2026, low confidence (Brampton).
The chart, ready to run
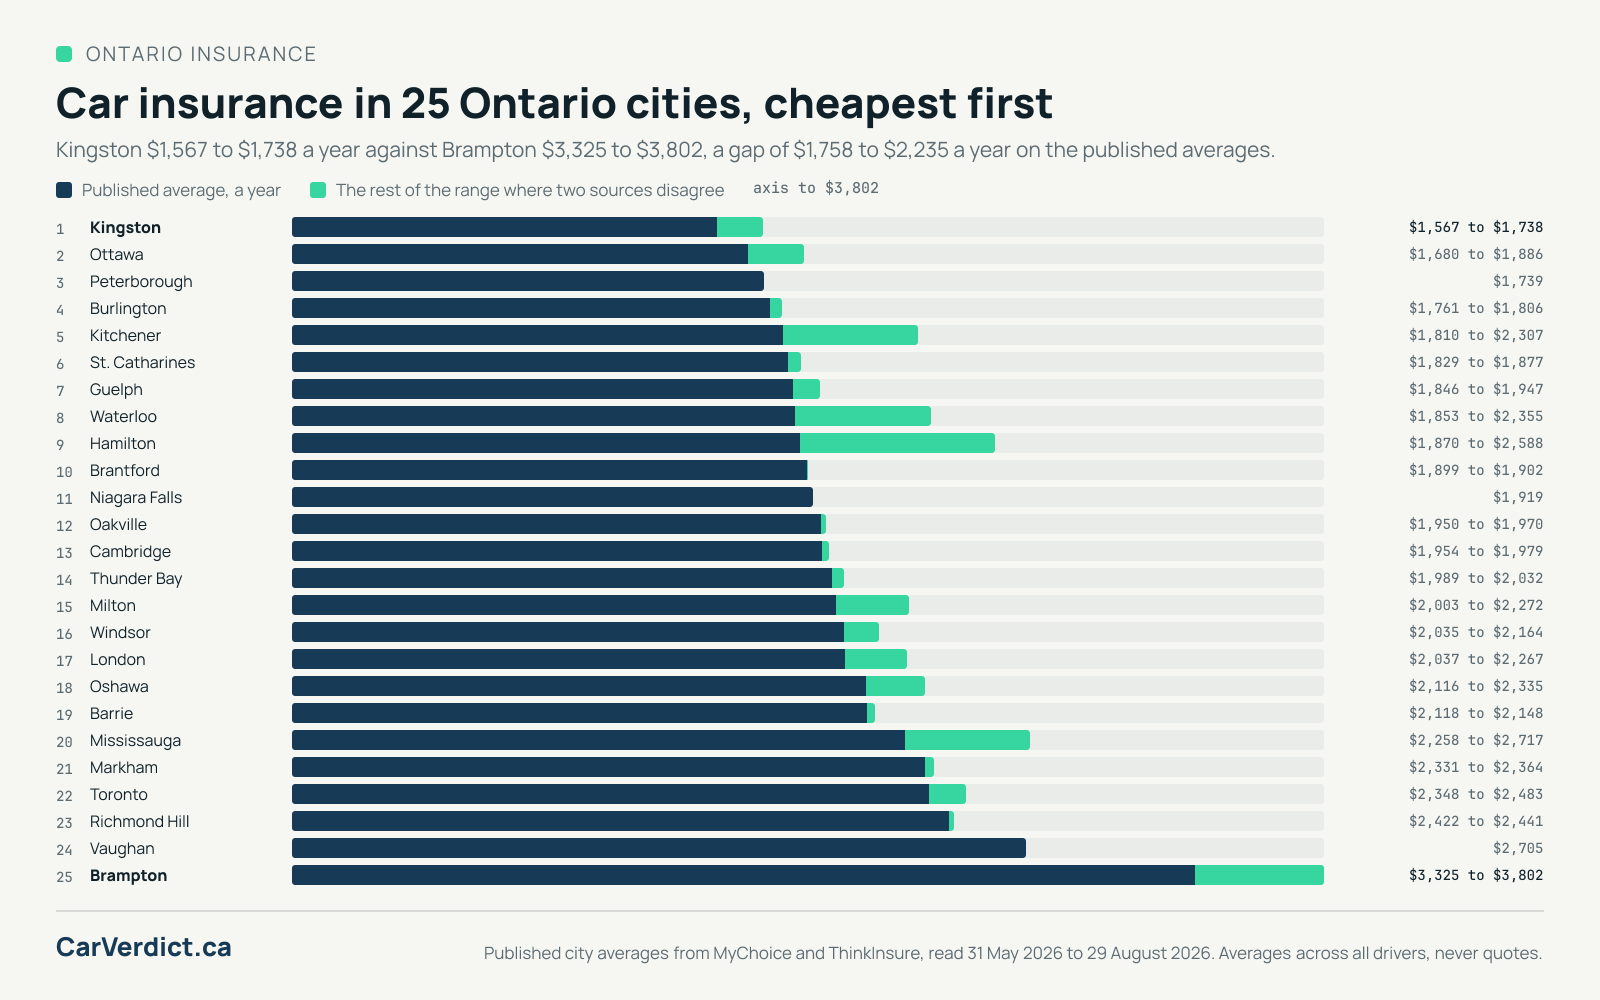
Download the chart as a PNG
The same car, in two cities
One scenario, run through the calculator twice with nothing changed but the city: a 2022 Honda CR-V at $35,000 on a $75,000 gross income, a driver aged 25 to 34 with good credit, nothing down, no trade-in, over 60 months from a dealer.
| City | Insurance, a month | Loan payment | All in, a month | Verdict |
|---|---|---|---|---|
| Brampton | $307 to $383 | $833 | $1,518 | Ouch |
| Ottawa | $155 to $190 | $833 | $1,340 | Ouch |
Open the Brampton run in the calculator and change the city to reproduce either column, or any other of the 25. The scenario is in the address, so the link is the working.
How the numbers are made
The calculator turns an income or a price into an all-in monthly cost: the loan payment, insurance, fuel or charging, maintenance and licensing, with Ontario tax on the purchase. It then reads that cost as a share of before-tax income and says whether it is easy, manageable, tight or worse. The arithmetic, the bands and the reason for each rule are on the methodology page. Every market figure it runs on, with its publisher, the date it was read, how often it needs refreshing and how much confidence it carries, is on the assumptions page. Where sources disagree and cannot be reconciled, the figure is withheld rather than averaged, which is set out in the editorial policy.
What this page does not claim
- These are not quotes. Every premium here is a published average across many drivers. No driver is promised any of them, and only an insurer or a licensed broker can price a real person and a real car. There is no quote partner connected to this site.
- These are not advice. The site is an estimate, and the figures that count are the ones a lender, an insurer or a dealer puts in writing.
- The confidence grade on a figure is a claim about the evidence behind it, not about the arithmetic. High means it is lifted from a primary source such as a statute or a regulator. Medium means a single named publisher states it directly. Low means it is modelled from the research or taken from a broker survey rather than from a regulator, and every low-confidence figure shows its working in its note on the assumptions page. Most of the city premiums in the table above are low, and that is on the page rather than hidden.
- The ranking covers the Ontario cities a published average exists for. It is a statement about our own sourced set, not a ranking of every municipality in the province.
What you may do with this
You may republish the figures and the chart on this page, in print or online, with a link to carverdict.ca. No permission request and no embargo. If you want the same-car run for a city you cover, or a figure checked before you file, ask and it will be answered the same day.
Figures on this page are computed when the site is built, from the same modules the rest of it renders from. Re-read them here on the day you file rather than from an email.